Given the importance of MDM scheme in providing nutrition, and helping increase enrolment and hence education of students, data/information about the scheme should be readily available and accessible to the common masses. Figure 9 lists essential data points/information regarding MDM that will be useful to various stakeholders. The current level of information available has been evaluated for these indicators.
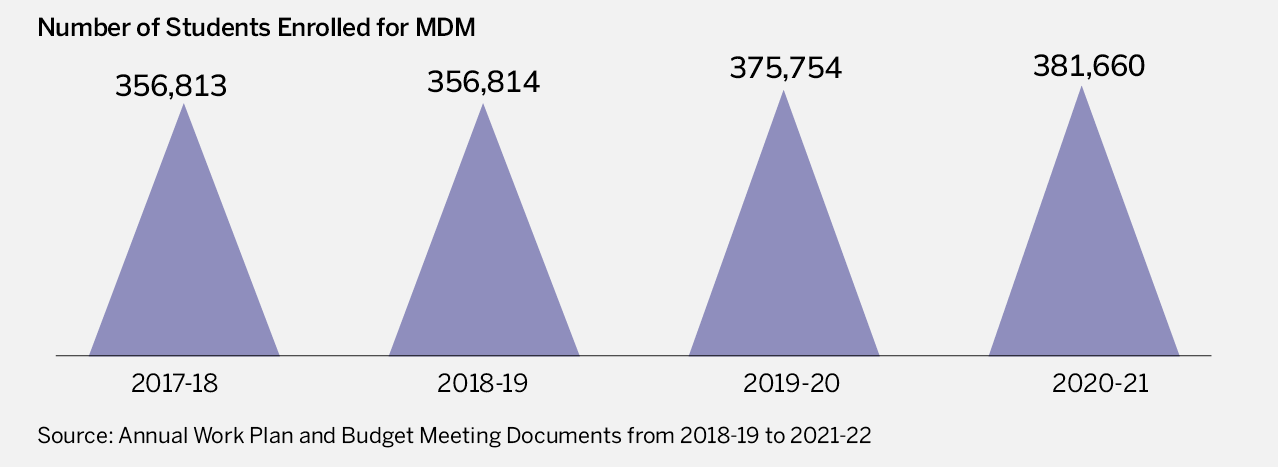
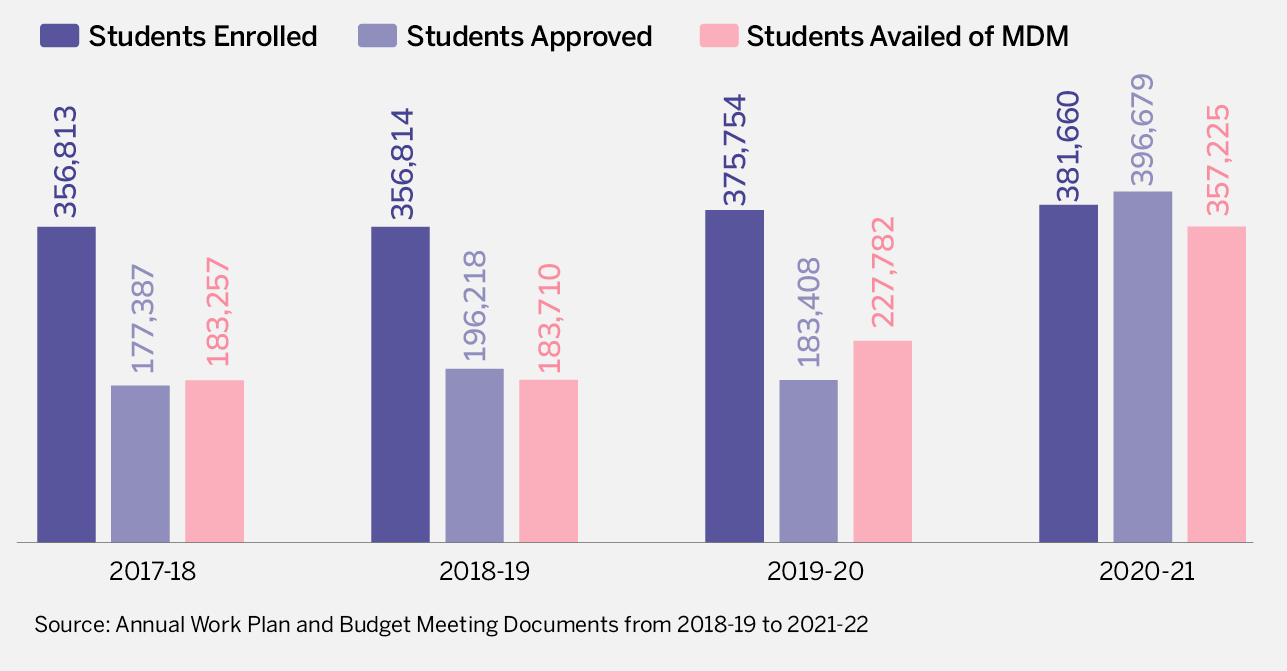
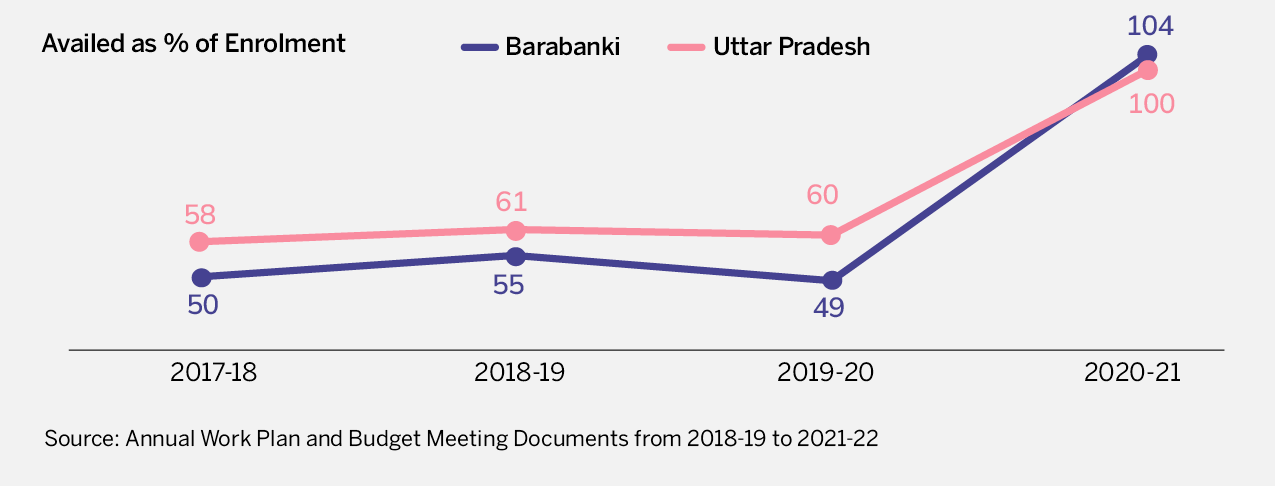
The data points /information regarding MDM have/has been taken from the Annual Work Plan and Budget Meeting Documents (AWB&PM) for the years from 2017-18 to 2020-21. These documents were accessed at https://pmposhan.education.gov.in/.
Transparency and Accountability Parameters
Availability of Information and Comprehensiveness
Information on funds allocated
Information on funds received
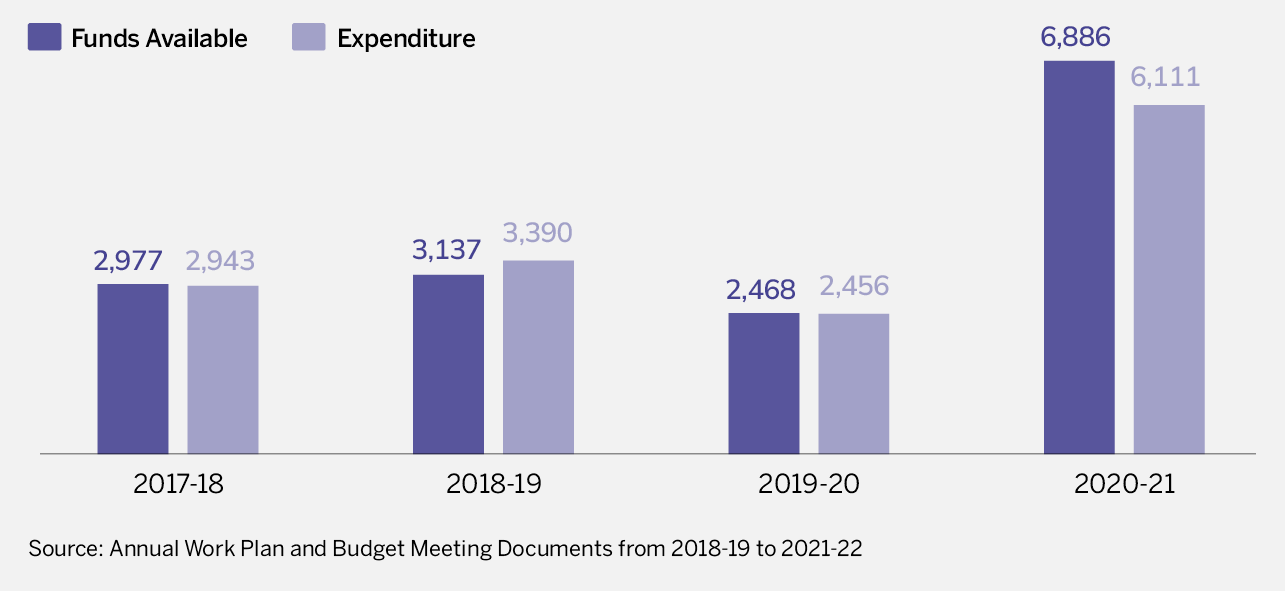
Information on funds available
Information on funds utilised
Information on funds for different components
Accessibility
Language in which information is available
Compatibility on devices
- Phone, tablet, laptop friendly
Timeliness
How frequently are data updated?
Relevance
How relevant would users find it
- The data available in the MDM website can be used by researchers, scholars and policy makers. While the information on the website is vast, further disaggregation of data based on gender can help understand the ways MDM affects education and the nutritional status of girl children.
Reliability
Are the data reliable?
- CAG audit reports are not available on the MDM website, hence authenticating the data with MIS and ground verification is essential.
Accountability and Citizen’s Participation
Social Audit schedules
- Social auditing is mandated for all districts.
- While the account for the number of schools covered, organisations/institutions conducting the audit and expenditure is available, the reports on the website are not up to date for all the states and years.
Availability of information on Grievance Redressal Mechanism for beneficiaries
- Contact details to lodge complaints are listed on the website for every state.
- Details on the number of complaints, status of complaints and action taken are also available.
- States follow different mechanisms for grievance redressal.